In a significant step towards enhancing accessibility and comprehension of complex charts and graphs, a team of researchers from MIT has created a groundbreaking dataset called VisText. The dataset aims to revolutionize automatic chart captioning systems by training machine-learning models to generate precise and semantically rich captions that accurately describe data trends and intricate patterns.
Captioning charts effectively is a labor-intensive process that often needs to be improved in providing additional contextual information. Auto Captioning techniques have struggled to incorporate cognitive features that enhance comprehension. However, the MIT researchers discovered that their machine-learning models, trained using the VisText dataset, consistently produced captions that surpassed those of other auto-captioning systems. The generated captions were accurate and varied in complexity and content, catering to the diverse needs of different users.
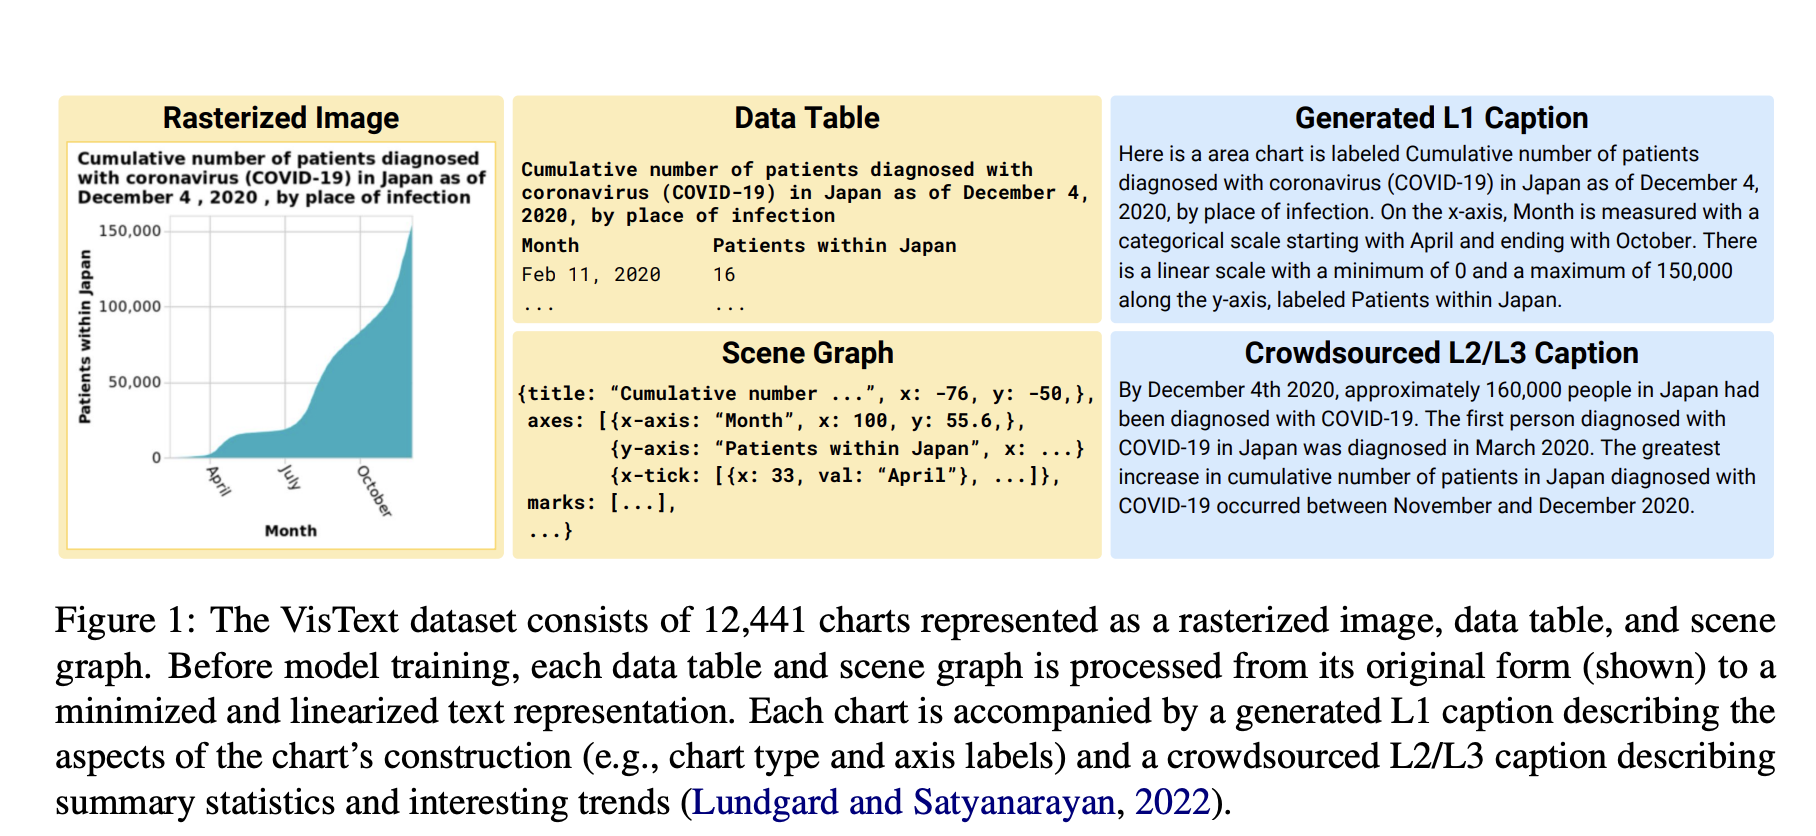
The inspiration for VisText stemmed from prior work within MIT’s Visualization Group, which delved into the key elements of a good chart caption. Their research revealed that sighted users and individuals with visual impairments or low vision exhibited varying preferences for the complexity of semantic content within a caption. Drawing upon this human-centered analysis, the researchers constructed the VisText dataset, comprising over 12,000 charts represented as data tables, images, scene graphs, and corresponding captions.
Developing effective auto-captioning systems presented numerous challenges. Existing machine-learning methods approached chart captioning in a manner similar to image captioning, but the interpretation of natural images differs significantly from reading charts. Alternative techniques disregarded the visual content entirely and relied solely on underlying data tables, often unavailable after chart publication. To overcome these limitations, the researchers utilized scene graphs extracted from chart images as a representation. Scene graphs offered the advantage of containing comprehensive information while being more accessible and compatible with modern large language models.
The researchers trained five machine-learning models for auto-captioning using VisText, exploring different representations, including images, data tables, and scene graphs. They discovered that models trained with scene graphs performed as well as, if not better, those trained with data tables, suggesting the potential of scene graphs as a more realistic representation. Additionally, by training models separately with low-level and high-level captions, the researchers enabled the models to adapt to the complexity of the generated captions.
To ensure the accuracy and reliability of their models, the researchers conducted a detailed qualitative analysis, categorizing common errors made by their best-performing method. This examination was vital in understanding the subtle nuances and limitations of the models, shedding light on ethical considerations surrounding the development of auto-captioning systems. While generative machine-learning models provide an effective tool for auto-captioning, otherwise misinformation can be spread if captions are generated incorrectly. To address this concern, the researchers proposed providing auto-captioning systems as authorship tools, enabling users to edit and verify the captions, thus mitigating potential errors and ethical concerns.
Moving forward, the team is dedicated to refining their models to reduce common errors. They aim to expand the VisText dataset by including more diverse and complex charts, such as those with stacked bars or multiple lines. Furthermore, they seek to gain insights into the learning process of auto-captioning models to deepen their understanding of chart data.
The development of the VisText dataset represents a significant breakthrough in automatic chart captioning. With continued advancements and research, auto-captioning systems powered by machine learning promise to revolutionize chart accessibility and comprehension, making vital information more inclusive and accessible to individuals with visual disabilities.
Check Out the Paper, Github Link, and MIT Article. Don’t forget to join our 25k+ ML SubReddit, Discord Channel, and Email Newsletter, where we share the latest AI research news, cool AI projects, and more. If you have any questions regarding the above article or if we missed anything, feel free to email us at Asif@marktechpost.com
Featured Tools:
🚀 Check Out 100’s AI Tools in AI Tools Club
Niharika is a Technical consulting intern at Marktechpost. She is a third year undergraduate, currently pursuing her B.Tech from Indian Institute of Technology(IIT), Kharagpur. She is a highly enthusiastic individual with a keen interest in Machine learning, Data science and AI and an avid reader of the latest developments in these fields.


