
In the realm of inferential statistics, you often want to test specific hypotheses about our data. Using the Ames Housing dataset, you’ll delve deep into the concept of hypothesis testing and explore if the presence of an air conditioner affects the sale price of a house.
Let’s get started.
Testing Assumptions in Real Estate: A Dive into Hypothesis Testing with the Ames Housing Dataset
Photo by Alex Staudinger. Some rights reserved.
Overview
This post unfolds through the following segments:
- The Role of Hypothesis Testing in Inferential Statistics.
- How does Hypothesis Testing work?
- Does Air Conditioning Affect Sale Price?
The Role of Hypothesis Testing in Inferential Statistics
Inferential Statistics uses a sample of data to make inferences about the population from which it was drawn. Hypothesis testing, a fundamental component of inferential statistics, is crucial when making informed decisions about a population based on sample data, especially when studying the entire population is unfeasible. Hypothesis testing is a way to make a statement about the data.
Imagine you’ve come across a claim stating that houses with air conditioners sell at a higher price than those without. To verify this claim, you’d gather data on house sales and analyze if there’s a significant difference in prices based on the presence of air conditioning. This process of testing claims or assumptions about a population using sample data is known as hypothesis testing. In essence, hypothesis testing allows us to make an informed decision (either rejecting or failing to reject a starting assumption) based on evidence from the sample and the likelihood that the observed effect occurred by chance.
How does Hypothesis Testing work?
Hypothesis Testing is a methodological approach in inferential statistics where you start with an initial claim (hypothesis) about a population parameter. You then use sample data to determine whether or not there’s enough evidence to reject this initial claim. The components of hypothesis testing include:
- Null Hypothesis ($H_0$): The default state of no effect or no different. A statement that you aim to test against.
- Alternative Hypothesis ($H_a$): What you want to prove. It is what you believe if the null hypothesis is wrong.
- Test Statistic: A value computed from the sample data that’s used to test the null hypothesis.
- P-value: The probability that the observed effect in the sample occurred by random chance under the null hypothesis situation.
Performing hypothesis testing is like a detective: Ordinarily, you assume something should happen ($H_0$), but you suspect something else is actually happening ($H_1$). Then you collect your evidence (the test statistic) to argue why $H_0$ is not reasonable; hence $H_1$ should be the truth.
In a typical hypothesis test:
- You state the null and alternative hypotheses. You should carefully design these hypotheses to reflect a reasonable assumption about the reality.
- You choose a significance level ($alpha$); it is common to use $alpha=0.05$ in statistical hypothesis tests.
- You collect and analyze the data to get our test statistic and p-value, based on the situation of $H_0$.
- You make a decision based on the p-value: You reject the null hypothesis and accept the alternative hypothesis if and only if the p-value is less than $alpha$.
Let’s see an example on how these steps are carried out.
Does Air Conditioning Affect Sales Price?
Based on the Ames Dataset, we want to know if the presence of air conditioning can affect the price.
news news news news news news news news news news news news news news news news news news
news news news news news news news news news news news news news news news news news news news
news news news news news news news news news news news news news news news
To explore the impact of air conditioning on sales prices, you’ll set our hypotheses as:
- $H_0$: The average sales price of houses with air conditioning is the same as those without.
- $H_a$: The average sales price of houses with air conditioning is not the same as those without.
Before performing the hypothesis test, let’s visualize our data to get a preliminary understanding.
|
1 2 3 4 5 6 7 8 9 10 11 12 13 14 15 16 17 18 19 20 21 22 23 24 25 26 27 28 29 30 31 32 33 |
# Loading the dataset and essential libraries import pandas as pd import numpy as np import matplotlib.pyplot as plt Ames = pd.read_csv(‘Ames.csv’) # Data separation ac_prices = Ames[Ames[‘CentralAir’] == ‘Y’][‘SalePrice’] no_ac_prices = Ames[Ames[‘CentralAir’] == ‘N’][‘SalePrice’] # Setting up the visualization plt.figure(figsize=(10, 6)) # Histograms for sale prices based on air conditioning # Plotting ‘With AC’ first for the desired order in the legend plt.hist(ac_prices, bins=30, alpha=0.7, color=‘blue’, edgecolor=‘blue’, lw=0.5, label=‘Sales Prices With AC’) mean_ac = np.mean(ac_prices) plt.axvline(mean_ac, color=‘blue’, linestyle=‘dashed’, linewidth=1.5, label=f‘Mean (With AC): ${mean_ac:.2f}’) plt.hist(no_ac_prices, bins=30, alpha=0.7, color=‘red’, edgecolor=‘red’, lw=0.5, label=‘Sales Prices Without AC’) mean_no_ac = np.mean(no_ac_prices) plt.axvline(mean_no_ac, color=‘red’, linestyle=‘dashed’, linewidth=1.5, label=f‘Mean (Without AC): ${mean_no_ac:.2f}’) plt.title(‘Distribution of Sales Prices based on Presence of Air Conditioning’, fontsize=18) plt.xlabel(‘Sales Price’, fontsize=15) plt.ylabel(‘Number of Houses’, fontsize=15) plt.legend(loc=‘upper right’) plt.tight_layout() plt.show() |
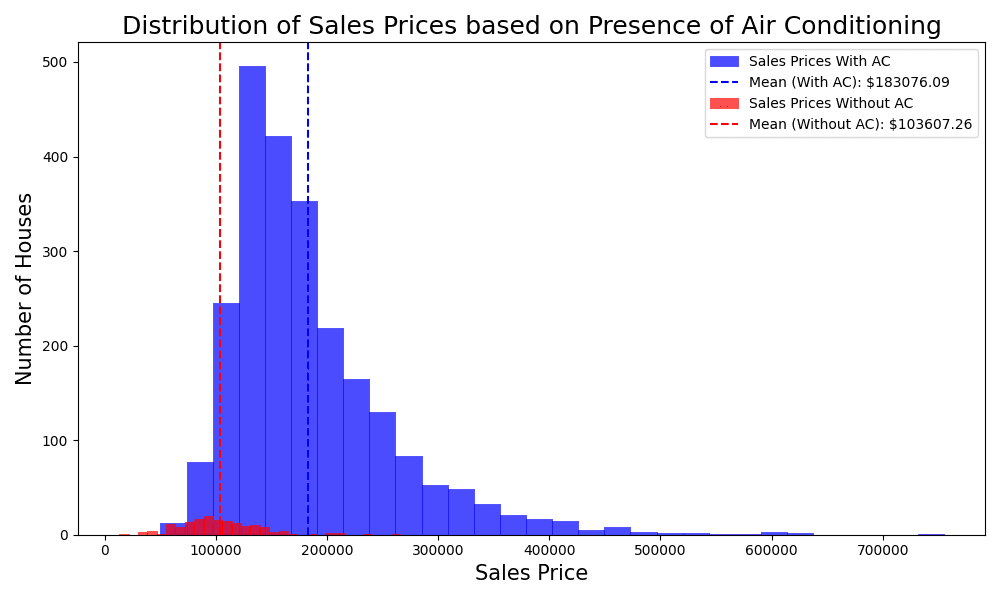
Overlapped histogram to compare the sales prices
The code above called plt.hist() twice with different data to show two overlapped histograms, one for the distribution of sales price with air conditioning (AC) and one without. Here are a few observations that can be made from the visual:
- Distinct Peaks: Both distributions exhibit a distinct peak, which indicates the most frequent sale prices in their respective categories.
- Mean Sale Price: The mean sale price of houses with AC is higher than that of houses without AC, as indicated by the vertical dashed lines.
- Spread and Skewness: The distribution of sale prices for houses with AC appears slightly right-skewed, indicating that while most houses are sold at a lower price, there are some properties with significantly higher prices. In contrast, the distribution for houses without AC is more compact, with a smaller range of prices.
- Overlap: Despite the differences in means, there’s an overlap in the price range of houses with and without AC. This suggests that while AC may influence price, other factors are also at play in determining a house’s value.
Given these insights, the presence of AC seems to be associated with a higher sale price. The next step would be to perform the hypothesis test to numerically determine if this difference is significant.
|
# Import an additional library import scipy.stats as stats # Performing a two-sample t-test t_stat, p_value = stats.ttest_ind(ac_prices, no_ac_prices, equal_var=False) # Printing the results if p_value < 0.05: result = “reject the null hypothesis” else: result = “fail to reject the null hypothesis” print(f“With a p-value of {p_value:.5f}, we {result}.”) |
This shows:
|
With a p-value of 0.00000, we reject the null hypothesis. |
The p-value is less than $alpha$. The p-value says that it is very unlikely, under $H_0$, that the difference in the price is by chance. This indicates that there’s a statistically significant difference in the average sale prices of houses with air conditioning compared to those without. This aligns with our visual observations from the histogram. Thus, the presence of an air conditioner does seem to have a significant effect on the sale price of houses in the Ames dataset.
This p-value is computed using t-test. It is a statistic aimed at comparing the means of two groups. There are many statistics available, and t-test is a suitable one here because our hypotheses $H_0$, $H_a$ are about the average sales price.
Note that the alternative hypothesis $H_a$ defined above can be changed. You can make it mean “the average sales price of houses with air conditioning is less than those without”; however, this is counter-intuitive to the reality. You can also make it mean “the average sales price of houses with air conditioning is more than those without”; which you should change the t-test in the code to include the extra argument alternative="greater":
|
t_stat, p_value = stats.ttest_ind(ac_prices, no_ac_prices, equal_var=False, alternative=“greater”) |
This changes the two-sided t-test to one-sided t-test, and the p-value should change.
Also note that, if p-value is small but not less than $alpha$, you may still believe the alternative hypothesis $H_a$ is true but the evidence is not strong enough to conclude. This is how appropriately setting up $H_0$ and $H_a$ can affect the conclusion.
Further Reading
Online
Resources
Summary
In this exploration, you delved into the world of hypothesis testing using the Ames Housing dataset. You examined how the presence of an air conditioner might impact the sale price of a house. Through rigorous statistical testing, you found that houses with air conditioning tend to have a higher sale price than those without, a result that holds statistical significance. This not only underscores the importance of amenities like air conditioning in the real estate market but also showcases the power of hypothesis testing in making informed decisions based on data.
Specifically, you learned:
- The importance of hypothesis testing within inferential statistics.
- How to set up and evaluate null and alternative hypothesis using detailed methods of hypothesis testing.
- The practical implications of hypothesis testing in real-world scenarios, exemplified by the presence of air conditioning on property values in the Ames housing market.
Do you have any questions? Please ask your questions in the comments below, and I will do my best to answer.
About Vinod Chugani
Born in India and nurtured in Japan, I am a Third Culture Kid with a global perspective. My academic journey at Duke University included majoring in Economics, with the honor of being inducted into Phi Beta Kappa in my junior year. Over the years, I’ve gained diverse professional experiences, spending a decade navigating Wall Street’s intricate Fixed Income sector, followed by leading a global distribution venture on Main Street.
Currently, I channel my passion for data science, machine learning, and AI as a Mentor at the New York City Data Science Academy. I value the opportunity to ignite curiosity and share knowledge, whether through Live Learning sessions or in-depth 1-on-1 interactions.
With a foundation in finance/entrepreneurship and my current immersion in the data realm, I approach the future with a sense of purpose and assurance. I anticipate further exploration, continuous learning, and the opportunity to contribute meaningfully to the ever-evolving fields of data science and machine learning, especially here at MLM.