Explaining keyword research to those unfamiliar with SEO to gain support can be challenging.
Stakeholders often find it difficult to grasp the value of SEO, and at the same time, SEOs struggle to communicate the benefits and contributions effectively.
Fortunately, there are strategies available for SEOs to bridge this gap by employing their keyword research more strategically and effectively.
This article explores a visual approach for effectively communicating keyword research insights with stakeholders outside the search industry.
Leveraging unique visuals
Non-SEO-savvy stakeholders may not know much about search keywords but likely understand general marketing concepts like the marketing funnel and audience segments.
You can use this understanding to explore keywords more deeply and create strategies that align with these broader marketing terms.
One critical yet frequently overlooked element here is search intent.
You can group keywords based on intent and create a bubble chart to visually represent the position of each keyword cluster within the marketing funnel, like the chart below.

The chart clearly shows the content needed to help searchers at each level of the marketing funnel. Overall, it reveals the necessary content for different stages of the funnel.
But it’s not just limited to that; you can also narrow it down to specific topics or subsets of keywords. This allows for a detailed analysis and a better understanding of the specific types of content needed for each topic.
Taking the above keyword intent visualization and drilling into the “all-weather tires” cluster shows that “Awareness” content should be produced to target these keyword clusters. Unlocking this insight means SEOs can match the searchers’ expectations.


This visualization shows how certain keywords help users move through the marketing funnel, and there are more actions you can take to optimize it further.
Companies often use audience personas or segments in broader marketing efforts. Integrating this knowledge is vital for effective communication, especially with stakeholders focused on paid search, as they commonly associate keywords with audience segments.
Likewise, by utilizing ChatGPT, SEOs can categorize keyword topics based on audience personas, resulting in a visual representation like the one below:
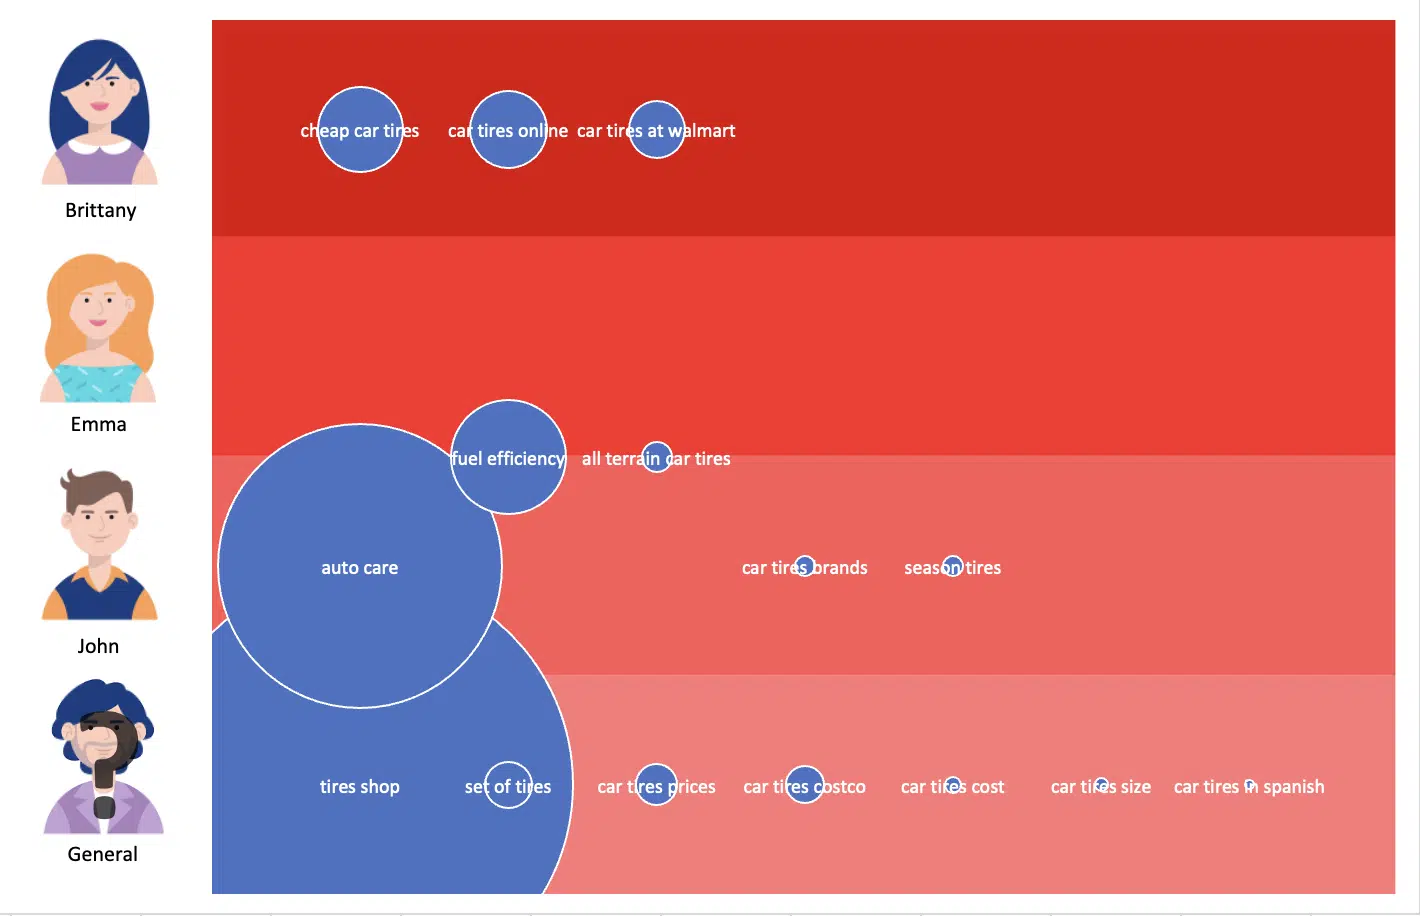

This chart displays the size of various topics and indicates which audience segments are most likely to engage with content related to those topics.
With these visuals, you are in a stronger position to develop more effective content strategies and enhance your communication with stakeholders outside the search domain.
Get the daily newsletter search marketers rely on.
How to build the visuals
The effectiveness of these two visuals is undeniable, though they require additional effort to develop.
Keyword intent cluster
SEOs can use various approaches to build keyword intent clusters, but I’ll outline the most straightforward and effective method.
To begin, we need more than just keyword data and search volume to craft this visual. Specifically, it will require top 10 organic listings and a keyword intent score.
A keyword intent score can be calculated through various means. I suggest you use a tool you can access that supplies keyword intent.
When creating my own visuals, I used the DataForSEO API and assigned a score for each SERP feature that appeared on a SERP, then calculated the average score for each keyword.
This can also be accomplished in a tool like Semrush by transforming the categorical keyword intents into a numerical scale.
When assigning a value for each intent, select a minimum value representing transactional intent and a maximum value representing informational intent. A blended intent can also be calculated by assigning a value between two intents.
We can create the intent clusters now that a numerical value has been established for keyword intent.
By gathering page 1 organic listings data, we leverage Google’s intelligence to create more accurate and relevant keyword clusters.
To create the clusters, compile the organic listings for a keyword into a list and compare it to another keyword list, keeping track of the number of similar pages appearing in each list.
Upon completing this analysis, we will be in a position to construct a similarity matrix for all the keywords, identical to the example provided below:
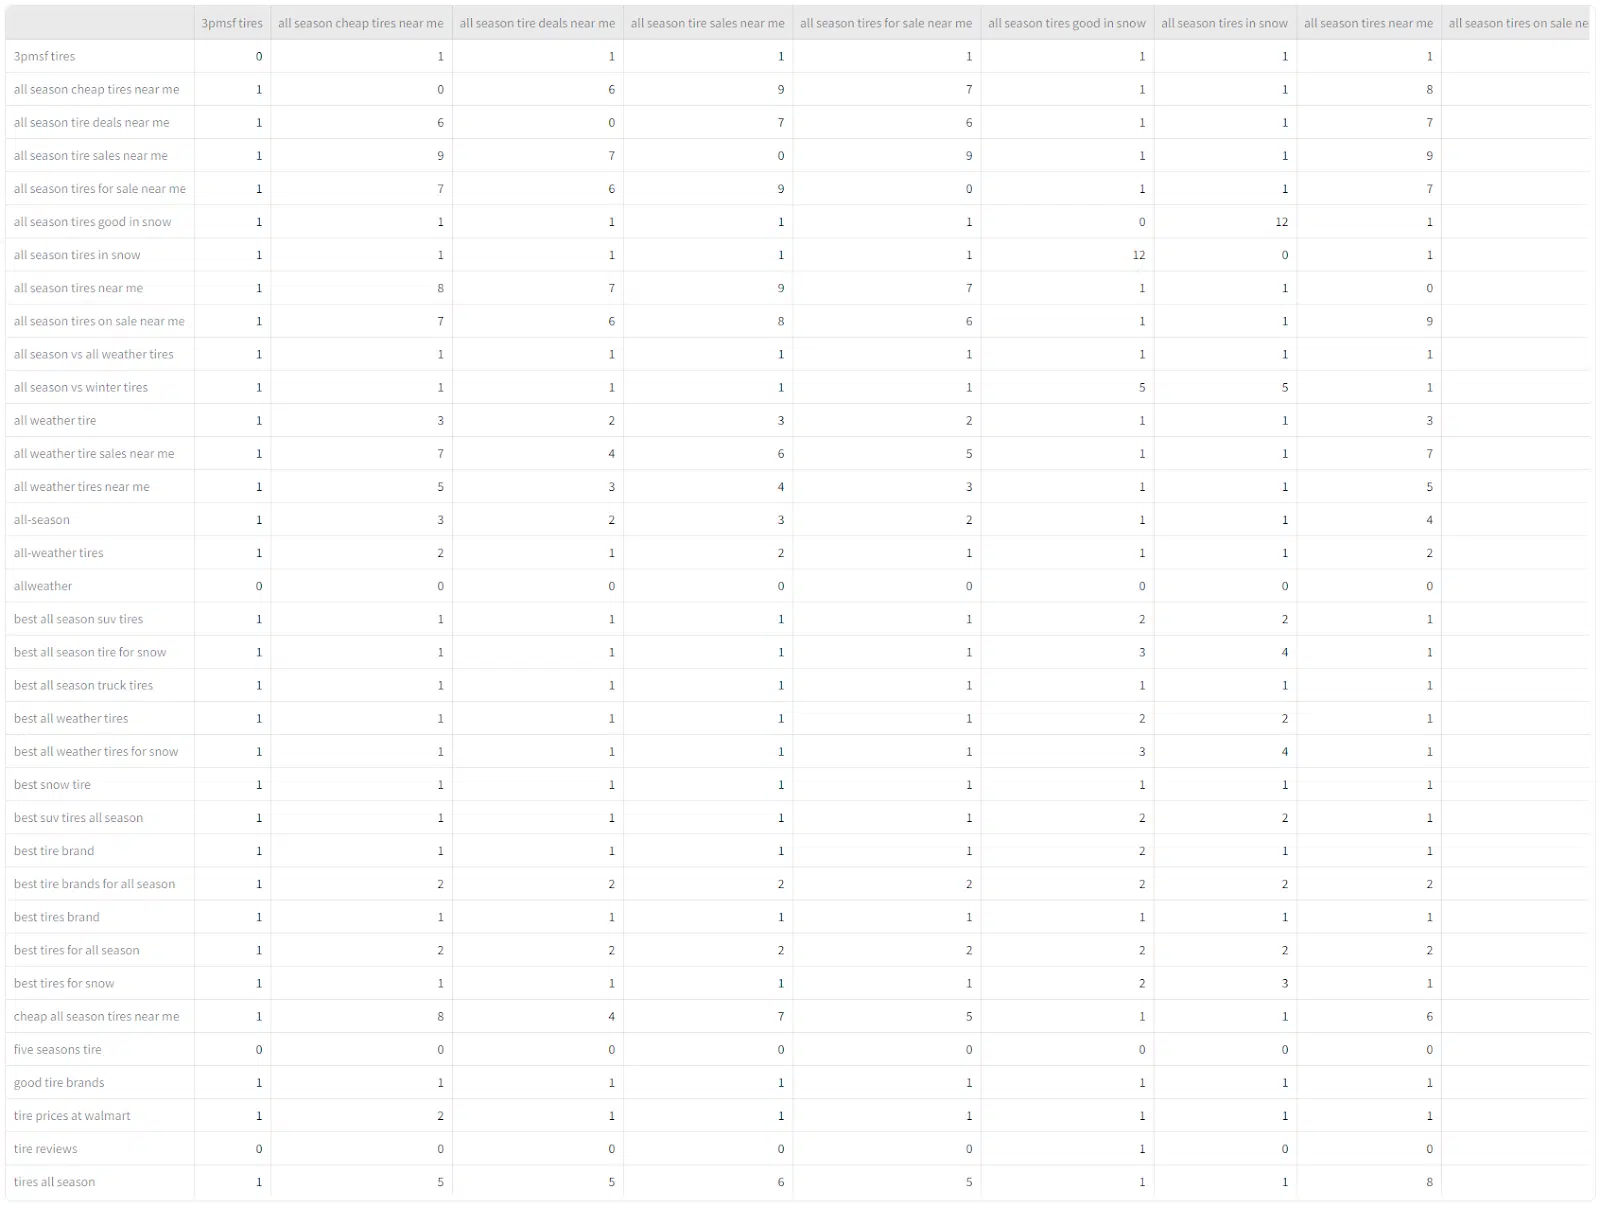

Next, create the clusters and aggregate all of their associated metrics. Through my experimentation, I discovered that establishing a threshold at 4 or 5 similar URLs resulted in the most cohesive clustering.
Once all keyword clusters have been aggregated along with their metrics, it’s time to assemble a bubble chart. The data at this point should closely align with the below:


Each cluster in the bubble chart should ideally start with a value of 0 on the x-axis unless you are in the process of fine-tuning the visual to reduce bubble overlap.
I advise initializing all clusters at 0 and making necessary adjustments to the data once the bubble chart has been generated.
This fine-tuning step is crucial. Without it, the visual can become unclear and difficult to comprehend. To see the impact of this step, compare the examples below.
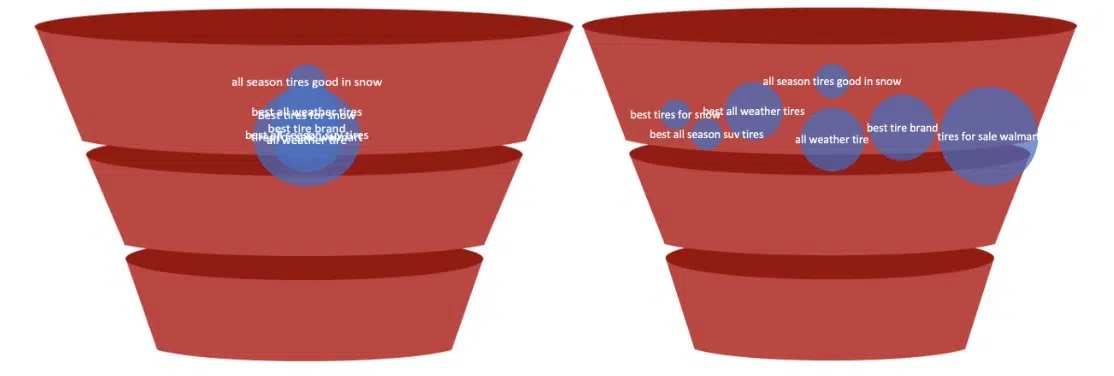

After fine-tuning, the visual is complete and ready to help communicate the value of specific keywords to stakeholders outside the search domain.
Associate topic clusters with audience personas
If you can access your company’s audience personas or segments, use this information to better align with stakeholders.
Integrating topic clusters with audience personas offers insight into the content that targets each audience within a business. These insights enable SEOs to identify content gaps and potential areas for improvement, equipping them with the necessary data to communicate more strategically.
A quick analysis of the chart below clearly reveals that the business is not effectively engaging with “Emma.” Consequently, when determining the direction for future content creation, they might utilize this insight as a valid reason to devise content that resonates more with “Emma.”


Similar to the keyword intent cluster visualization, there are various ways to create this chart. I’ll share the simplest method I’ve found.
Start by giving ChatGPT your audience personas and asking it to summarize each. This helps make sure that ChatGPT really understands them.
Here is an example prompt:
“I have a list of topics that I would like you to categorize based on the audience personas that I will provide and your knowledge of each topic. Before starting, write a paragraph about each persona to ensure you understand them well. Then I will give you the list of topics to categorize. After categorizing the keywords, please return them to me in a table that I can copy and paste into Excel.
Persona 1:
NAME: INSERT PERSONA NAME
DESCRIPTION: INSERT PERSONA DESCRIPTION – RECOMMENDED >100 WORDS
DEMOGRAPHICS:
AGE: …
GENDER: …
LOCATION: …
EDUCATION: …
INCOME: …
FAMILY LIFE: …
STRUGGLES: INSERT LIST OF STRUGGLES/PAIN POINTS
HOBBIES: INSERT LIST OF HOBBIES
VALUES: LIST PERSONAL VALUES OF THIS PERSONA
Persona 2:
[INSERT PERSONA KNOWLEDGE]
Persona 3:
[INSERT PERSONA KNOWLEDGE].”
When creating this prompt, provide ChatGPT with comprehensive details about each persona. This helps it establish the best understanding of the audience personas possible, which can be verified through the summaries.
After confirming that it has an accurate grasp of the personas, proceed by uploading the list of keyword topics that require categorization.
If all goes well, ChatGPT should generate a table for you that is separated by commas and resembles the following structure:


Next, simply transfer the output to Excel and utilize the “Text to Columns” feature to split the data effectively.
Once the data has been collected, convert the audiences’ names into values for the bubble chart. So, this is to say that Brittany will now be represented by the number four on the y-axis.
For topics assigned to two or more audiences, take the average of the audience number.
An example is the topic “fuel efficiency,” which was categorized for John and Emma, so it was assigned 2.5 as an audience value.
After gathering all necessary data, transform the audience names into numerical values for the bubble chart.
To illustrate, Brittany will be represented as the number four on the y-axis. For topics assigned to two or more audiences, calculate the mean of the audience numbers.
Take, for instance, the topic “fuel efficiency,” attributed to both John and Emma, resulting in an assigned audience value of 2.5.
Subsequently, count the number of subjects assigned to each audience and allocate a numerical value to each topic, indicating its position on the x-axis. The data should closely resemble the example below:
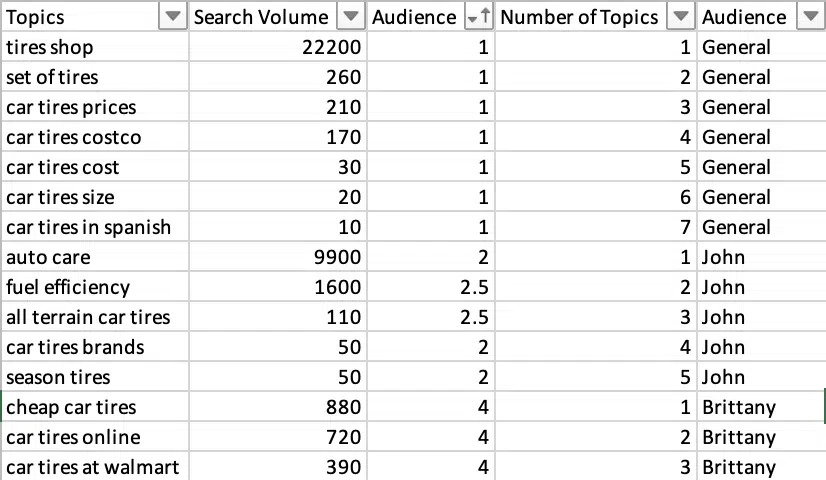

After gathering all necessary data, SEOs can create a bubble graph using Excel.
They can enhance the graph by incorporating additional visual elements, such as background images or gradients, to delineate segments for each target audience clearly.
Visualizing complex SEO concepts for effective stakeholder communication
Bridging the gap between SEO concepts and stakeholder understanding is challenging but crucial.
With keyword intent clusters and audience persona charts, SEOs have a streamlined and visual way to convey complex concepts.
Using the visual aids discussed in this article, you can approach stakeholders with more strategic content insights that align with familiar concepts.
Opinions expressed in this article are those of the guest author and not necessarily Search Engine Land. Staff authors are listed here.


